New Consumer Insight Report Now Available!

The Growing 35+ Gamer Market

If you’re in the business of making games, you need to understand the emerging trends and opportunities in the 35+ gamer market. A generation that grew up with gaming is now evolving and represents a growing, distinct market segment with specific needs and motivations:

  • Learn about the dramatic shifts in gaming motivations as people age.
  • Be prepared for how the gaming market will change as the 35+ segments grows.
  • Get concise explanations of what different age segments look for in games.
  • Use these segments to adapt to the changing market and tailor effective messages.

We generated this report using data from over 170,000 gamers between the ages of 15 and 64 to understand how gaming motivations, genre preferences, and popular games change as men and women age.

Explore the Content in Our Detailed 55-Page Report

Detailed Charts of How Motivations Change with Age

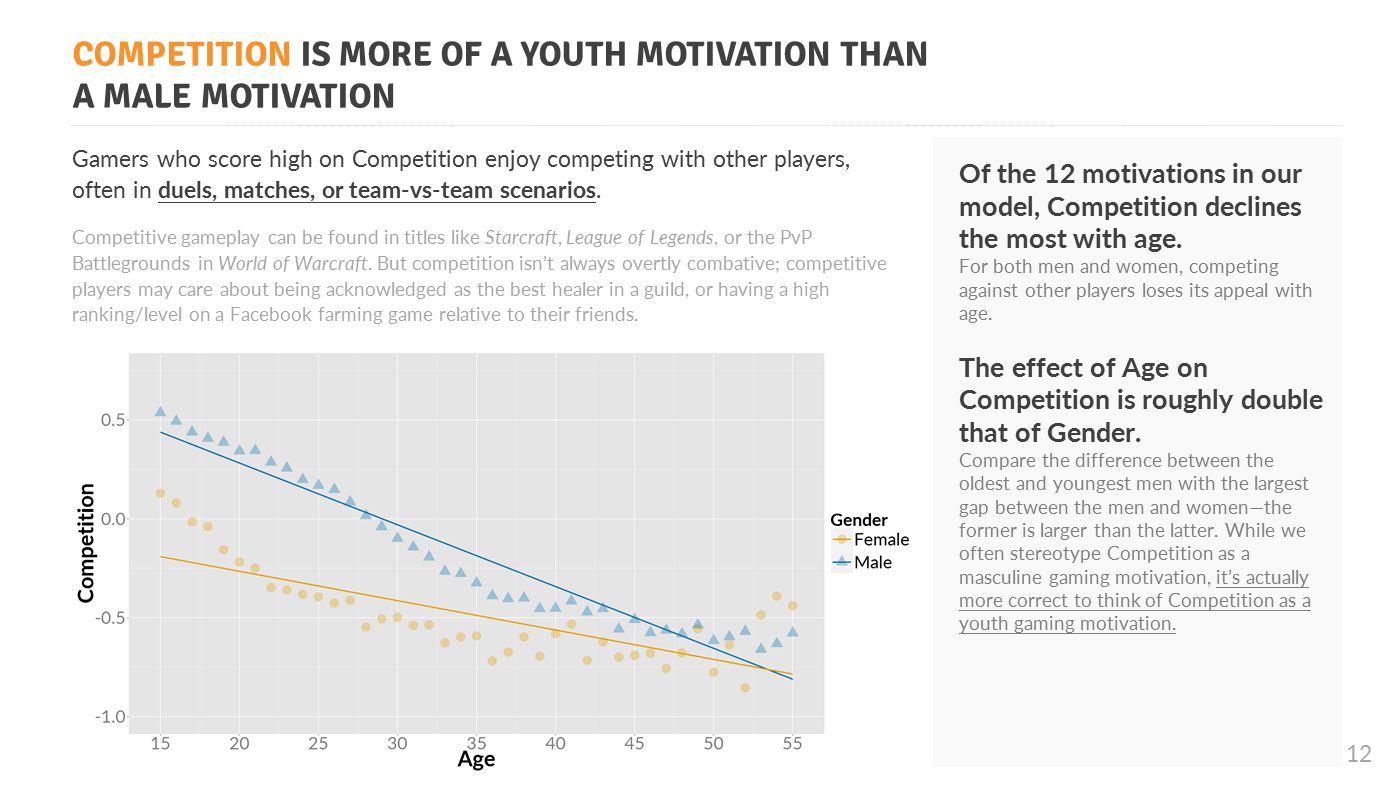
Detailed charts and explanations of how each of the 12 motivations in our Gamer Motivation Model changes between the ages of 15-55 and broken down by gender. Based on data from over 170,000 gamers.

See our blog post on the game motivations that change the most and the least as gamers age.

Nick Yee and Nic Ducheneaut have over 40 peer-reviewed papers on gaming and virtual worlds. Our research on online gaming motivations research has been cited over 1,400 times. Our current Gamer Motivation Model was developed via factor analysis of survey data, and this report was generated using data from over 170,000 gamers.
We created a Gamer Motivation Profile where gamers could complete a 5-minute survey, get their personalized motivation profile, and share it online. About 80% of our traffic came from social media sharing.
Survey data from 177,410 gamers were used to generate this report. 82% of the respondents were male, 17% were female, and 1% were non-binary gender. The median age was 25, with a range from 13-74.

The survey was conducted in English only, and the majority of the respondents came from North America, followed by the EU.

11% of the respondents self-identified as casual, 67% as core, and 21% as hardcore. In terms of platform, 83% regularly game on PCs, 55% on consoles, 35% on smartphones, and 25% on handheld consoles.

The most popular genres listed by respondents were RPG (28%), Shooters (25%), Action Adventure (18%), Strategy (14%), Action (13%), MMO (8%), RTS (7%), and Puzzle (7%).

80% of our sample was recruited organically via social media sharing by gamers who had taken our Gamer Motivation Profile. No material or financial incentive was provided to our respondents.

In terms of sampling bias (compared with ESA 2015 report), our sample skews towards a younger, male, core PC gamer demographic. The analysis in this report breaks down the data by gender and age, and thus controls for the primary demographic biases. The sampling bias favors PC gamers, but the frequencies of console/smartphone/handheld console usage match the ESA report (within 1% point). Thus, while our sample is not representative of all gamers, we believe the findings in this report accurately describe the core gamer market.

Concise Tables of the Most and Least Important Motivations for Each Age Segment

We provide the data at multiple levels of granularity and always start each section with a summary of the most important findings.

We use the following age segments in the report:

15 – 24
25 – 34
35 – 44
45 – 54
55 – 64 (men only)

Charts of How Genre Appeal Varies by Age

For men and women separately, we identify the game genres whose appeal increases and decreases the most across age (as well as the genres that are most age stable).

Popular Games and Gaming Emphasis for Each Age Segment

We provide both concise summary tables and detailed charts of the popular games for each age segment, and the psychological gaming emphasis that drives each age segment.

Unadjusted percentages are the simple frequencies of each game title listed as a favorite divided by the total sample size. But this method means that highly popular games (like World of Warcraft) tend to dominate the lists and crowd out games where there are large age differences. The adjusted lists divide the local frequency by the baseline frequency. Thus a QF score of 2 means this age group listed a game title at twice the baseline frequency.

We recommend using the exaggerated differences in the adjusted list to understand how gamers may approach the games in the unadjusted list differently. For example, World of Warcraft caters to many different styles of play. The adjusted list provides clues as to what those may be for this particular age group.

Table of Contents

Our 55-page report begins with an executive summary and an overview of the trends and opportunities in the 35+ market. After a very brief description of our Gamer Motivation Model, the main report consists of 4 sections that explore how age intersects with gaming motivations, game genres, and popular game titles.

Contact Us

    Your Name (required)

    Your Email (required)

    Subject

    Your Message