Gamer Motivation Insight Report

(New 2025 Version)

Based on data from over 466,000 gamers, this 86-page report delivers a comprehensive, up-to-date analysis of how gaming motivations and preferences shift across key demographic groups.

What’s inside:

  • Clear, visually engaging charts showing how all 12 core gaming motivations vary by gender and age.
  • Concise, actionable summaries of what each demographic cohort values most in games—and how these preferences evolve over time.
  • Motivation anchors and safe differentiators to help you position your game effectively for each audience segment.
  • Extensive reference tables of popular game titles, genres, themes, game modes, and camera perspectives by demographic group.
  • Strategic guidance for persona development, helping you craft tailored marketing and product messaging grounded in robust behavioral data.

Data you can trust: All findings are based on survey responses from 466,000+ gamers aged 13–64, collected between January 2023 and April 2025 via the Gamer Motivation Profile. Respondents are not financially incentivized and primarily take the survey to receive an accurate, personalized motivation profile, resulting in an engaged participant pool and a high-integrity data set.

If you’d prefer to purchase this report via a SOW/invoice route, please contact us at team@quanticfoundry.com.

If you purchased the 2024 or 2021 version of the Motivation Insight Report, you’re eligible for a 30% or 15% discount respectively on this report. Current subscribers to our Dashboard are also eligible for a 30% discount. To redeem your discount code, please contact us at team@quanticfoundry.com.

Explore the Content in Our Detailed 86-Page Report

Track Motivation Shifts and Identity Key Pivot Points

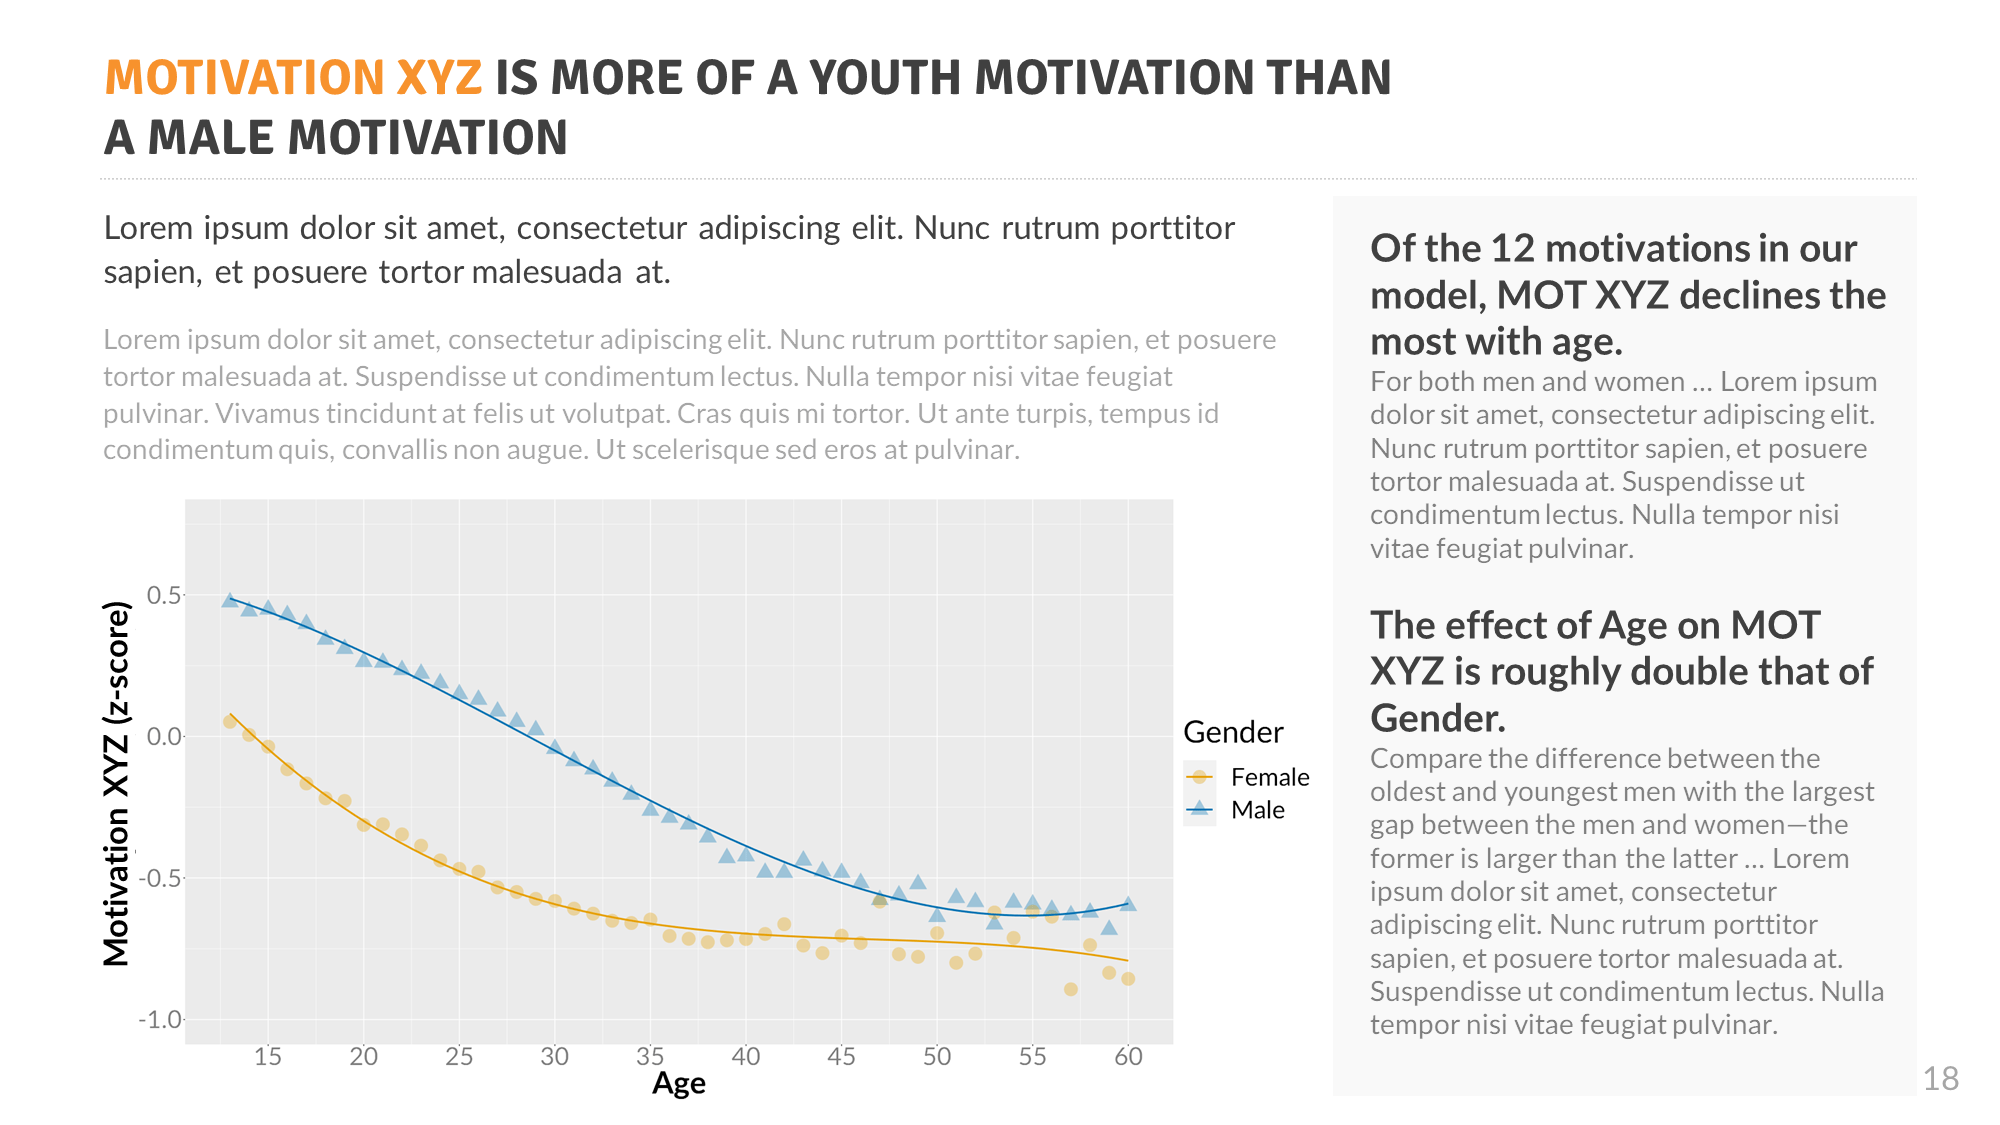
Gaming motivations evolve with age and not all motivations follow the same trajectory. Some remain remarkably stable over time, while others show sharp declines or pivotal shifts at key life stages. This section helps you identify when and how these changes occur, revealing both critical turning points and periods of motivational stability.

You’ll find detailed charts and clear explanations showing how each of the 12 motivations in the Gamer Motivation Model shifts across age (13–64), with trends broken out by gender for deeper insight.

Developed by Dr. Nick Yee and Dr. Nic Ducheneaut who have published more than 40 peer-reviewed papers on gaming and virtual worlds. Our earlier research on online gaming motivations has been cited over 4,500 times. Our current Gamer Motivation Model was built using factor analysis of large-scale survey data to identify the core dimensions of what drives players to engage with games.

This report leverages the latest data from over 466,000 gamers, providing a robust, empirically validated foundation for understanding audience motivations at scale.

We created a Gamer Motivation Profile where gamers could complete a 5-minute survey, get their personalized motivation profile, and share it online. Our traffic comes from a combination of organic searches (we’re top ranked for “Gamer Motivation”, “Game Recommendation”, “Gamer Type”, etc.) and social media sharing.

Survey data from 466,266 gamers was used to generate this report. 72% of the respondents were male, 22% were female, and 6% were non-binary. The median age was 23, with a range from 13-64, and a standard deviation of 7.37.

13% of the respondents self-identified as casual, 68% as core, and 19% as hardcore. In terms of platform, 80% regularly game on PCs, 50% on consoles, 35% on smartphones, 25% on handheld consoles, and 7% on VR.

The sample has the following regional distribution: North America: 43.5%, Western Europe 21.7%, South America: 9.1%, Eastern Europe: 5.1%, Southeast Asia: 4.4%, Southern Europe: 3.2%, East Asia: 3.0%, Central America: 2.8%, Australasia: 2.8%, Scandinavia: 2.3%, Middle East: 1.5%, Africa: 0.6%, Central Asia: 0.1%

Overall, our data sample leans towards a core PC/console gamer audience and is most robust in tracking the trends in the core gamer population.

Respondents from Mainland China were excluded from the analysis due to substantial regional differences in gaming motivations (likely due to their more isolated gaming ecosystem) which presents an analytic/interpretation challenge in terms of high-level data aggregation and balancing.

Respondents to the Gamer Motivation Profile come from organic searches for gaming-related terms (we’re top ranked for “Gamer Motivation”, “Game Recommendation”, “Gamer Type”, etc.) as well as social media sharing from gamers who share their motivation profile results. No financial incentive is provided to our respondents. Respondents primarily take the survey to get an accurate assessment of their gaming motivations and this creates a high quality data set from highly-motivated respondents (compared to the typical issues related to low-effort respondents in panel-based financially-incentivized surveys).

Discover What Drives Each Demographic Cohort

We segment the gaming audience into 10 distinct demographic cohorts based on age and gender, providing a focused analysis of each group. Each section begins with a concise summary of the key insights, followed by deeper, data-rich analysis at multiple levels of granularity.

Quickly grasp the broad motivational differences across cohorts and then explore the detailed breakdowns that reveal what truly matters to each audience segment.

We use the following age ranges to define cohorts in the report (further broken down by gender):

15 – 24
25 – 34
35 – 44
45 – 54
55 – 64

Align Game Features and Messaging with Motivation Profiles

For each of the 10 demographic cohorts, we provide detailed motivation profile charts that highlight which motivations are over- or under-indexed relative to the overall gamer population. These profiles help you prioritize the features and mechanics most likely to resonate with each audience segment. Use these insights to tailor your messaging accordingly.

Side-by-side comparison charts by gender within each age cohort further clarify key differences and shared preferences. These findings point to design opportunities and challenges, helping you optimize for both coverage and satisfaction across diverse player groups.

Navigate Uncertainty with Motivation Rubric Maps

Our Motivation Rubric Maps help you identify the game features that are considered core and necessary for each cohort (i.e., low risk, high coverage) and those that can be used as differentiators (i.e., high risk, lower coverage). These maps provide empirical guidance to maximizing audience cohorts, minimizing risk, and making the best bets in terms of differentiating your game in a crowded gaming landscape.

In the report, a Rubric Map is provided for each of the 10 demographic cohorts.

Here are 3 take-aways from this example map:

  • The low appeal of Competition and its very low variance means that if we’re designing a game for this cohort, a core design constraint is that competition is minimized and that the player can choose to experience the game in a non-adversarial path.
  • Blending a rich world setting with chaotic mayhem is a safe bet for this cohort. Similarly, this cohort is looking for slower-paced, more accessible gameplay.
  • Players in this cohort vary considerably in how much they care about Strategy and Community. To maximize coverage of this audience, it’s important to provide a variety of options (or branching game modes) that vary on strategic complexity and social interaction. Alternatively, the game team may decide to focus on a niche within this cohort—e.g., a game that leans more both towards Strategy and Community, and understanding that doing so means they will alienate some gamers in this cohort that don’t want these things.

Reference Popular Games by Demographic Cohort

For each cohort, we include both concise summary tables and in-depth charts highlighting the most and least popular games—alongside the motivational drivers behind these preferences. This section connects psychological motivation profiles to actual game choices, helping you understand not just what each cohort plays, but why.

The QF Score is an odds ratio that adjusts for games that are pervasively popular within the gaming community and would otherwise always show up near the top in terms of raw percentage of mentions.

Unadjusted raw percentages are the simple frequencies of each game title listed as a favorite divided by the total sample size. But this method would mean that highly popular games (like Fortnite or Skyrim) tend to dominate the lists and make it difficult to see and analyze games that are disproportionately popular within each cohort. The game lists we provide divide the local frequency by the baseline frequency. Thus a QF score of 2 means this cohort mentioned a game title at twice the baseline frequency.

Identify Popular Genres, Themes, Modes, and Perspectives Within Each Cohort

Using IGDB meta tags, we analyzed the relative popularity of game genres, themes, modes, and perspective within each demographic cohort. This cross-referenced approach reveals the content styles and structural elements that resonate most with different audiences, providing actionable insights for content planning, feature prioritization, and genre alignment.

In the Gamer Motivation Profile survey, we don’t ask about genre preference directly. Instead, we ask gamers to list game titles they enjoy playing. We maintain a clean, canonical list of game titles by cross-referencing with IGDB, and IGDB also provides metatag information for all games (e.g., genres, themes, platforms).

By looking up the genre tags associated with each game in each cohort’s popular games list, we can infer the popular genres for each cohort.

Table of Contents

This 86-page report opens with an executive summary and a high-level overview of key trends and strategic opportunities. Following a brief introduction to the Gamer Motivation Model, the core of the report is organized into 10 sections that examine how age and gender intersect with gaming motivations, specific game titles, and game genres and themes. Each section provides data-driven insights to support game design, marketing strategy, and audience segmentation.

In the 2025 version of the report, we’ve added new sections for each demographic cohort that break down additional game preferences: game theme (e.g., horror, fantasy), game mode (e.g., single-player, co-op), and game perspective (e.g., first-person, bird’s eye view).

This report is provided by Quantic Foundry LLC for the sole use of the recipient. Use is only authorized for internal purposes. Prior written permission from Quantic Foundry is required should the recipient wish to pass on the Report in any form, electronic or otherwise, to any third party.

Quantic Foundry LLC Copyright © 2025
All rights reserved

Contact Us

Email us directly at team@quanticfoundry.com, or use the form below:

    Your Name (required)

    Your Email (required)

    Subject

    Your Message